main topic
Suppose you wish to generate various benchmark statistics for your product, but you do not have the complexity data available.
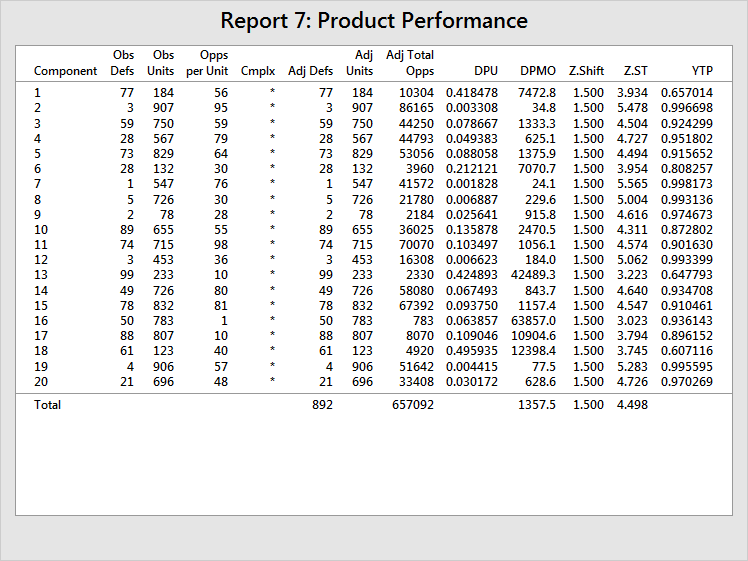
The product report shows:

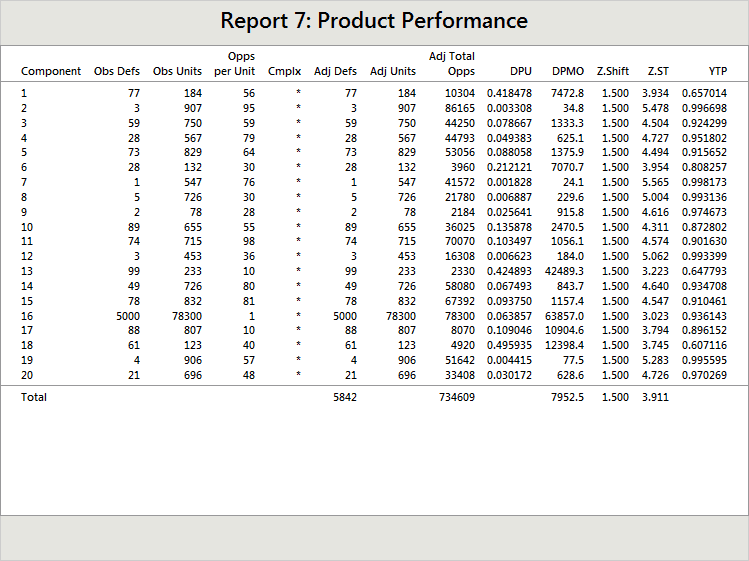
The total opportunities count is 657,092 and the total DPMO is 1357, which translates to an overall Z.ST of 4.498. Now take Component 16, which has the lowest Z.ST (in other words, the worst capability). Suppose that, due to an upcoming scheduled downtime for the process that makes Component 16, you ramp up production and produce 100 times as many units of Component 16, and also observe 100 times as many defects.

The total opportunity count was not affected much - it went from 657,092 to 734,609. However, total DPMO went from 1357 to 7953 (6 times as high) and total Z.ST went from 4.498 to 3.911, again a dramatic reduction of about one-half sigma. This was all due to the change in production of Component 16, not because of any decay in capability.
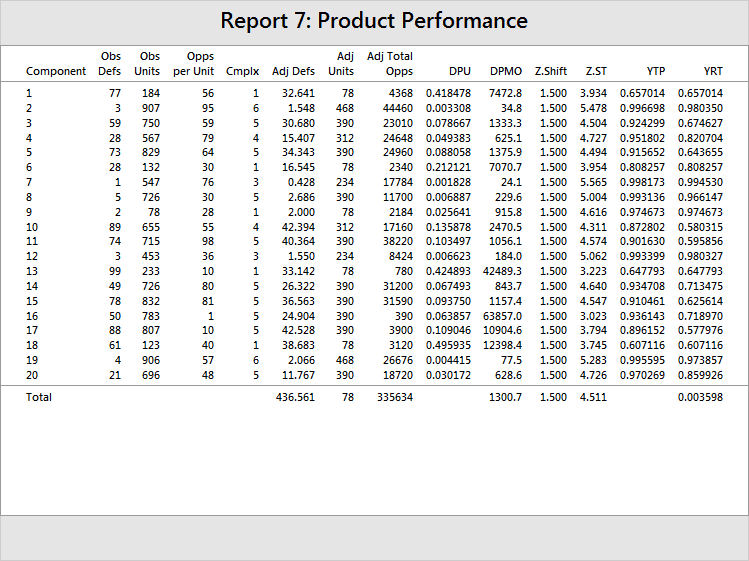
Here is the same analysis with complexity data:

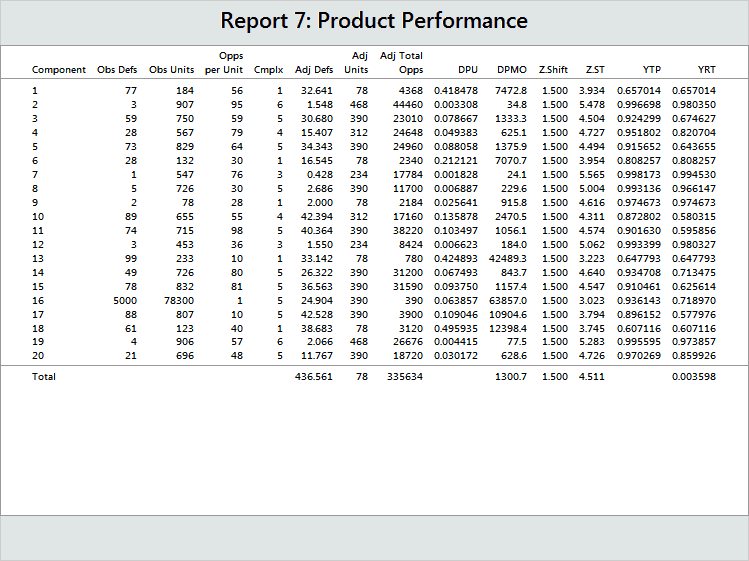
Now the total DPMO is 1300.7, with a total Z.ST of 4.511. Remember, these should be slightly different from the original figures because you have used the complexity data to adjust the unit counts and the defect counts. Now, step up the production of Component 16 as before, this time with the complexity data.

Here see that the only differences are in the observed units and observed defects for Component 16. Using complexity data completely removed any effect due to the disproportionate production and sampling of Component 16.