main topic interpreting results session command see also
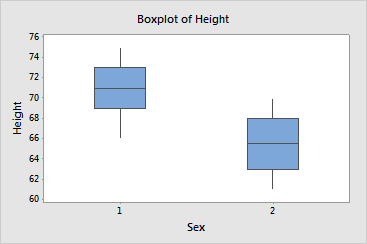
You want to compare the height (in inches) of male (Sex=1) and female (Sex=2) students who participated in the pulse study. You choose to display a boxplot of the data.
1 Open the worksheet PULSE.MTW.
2 Choose Stat > Basic Statistics > Display Descriptive Statistics.
3 In Variables, enter Height.
4 In By variable, enter Sex.
5 Click Graphs and check Boxplot of data. Click OK in each dialog box.
Session window output
Descriptive Statistics: Height
Variable Sex N N* Mean SE Mean StDev Minimum Q1 Median Q3 Maximum Height 1 57 0 70.754 0.342 2.583 66.000 69.000 71.000 73.000 75.000 2 35 0 65.400 0.433 2.563 61.000 63.000 65.500 68.000 70.000 |
Graph window output

The means shown in the Session window and the boxplots indicate that males are approximately 5.3 inches taller than females, and the spread of the data is about the same.