main topic interpreting results session command see also
Students in an introductory statistics course participated in a simple experiment. Each student recorded his or her resting pulse. Then they all flipped coins, and those whose coins came up heads ran in place for one minute. Then the entire class recorded their pulses. You want to examine the students' resting pulse rates.
1 Open the worksheet PULSE.MTW.
2 Choose Stat > Basic Statistics > Graphical Summary.
3 In Variables, enter Pulse1. Click OK.
Graph window output

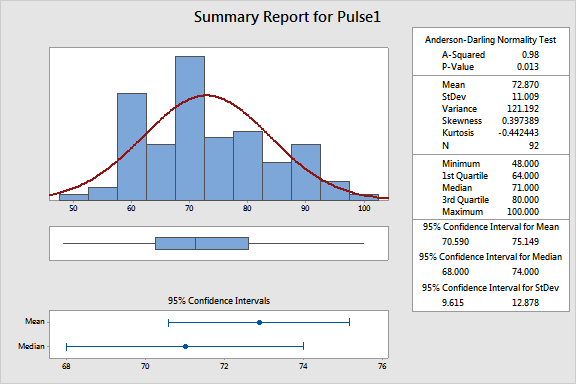
The mean of the students' resting pulse is 72.870 (95% confidence intervals of 70.590 and 75.149). The standard deviation is 11.009 (95% confidence intervals of 9.615 and 12.878).
Using a significance level of 0.05, the Anderson-Darling normality test (A-Squared = 0.98, P-Value = 0.013) indicates that the resting pulse data do not follow a normal distribution.