main topic interpreting results session command see also
You created a new, less expensive formulation of your popular cat food for discount retailers. You want to ensure that the protein content of the discount food is the same as that of your original food. You measure the amount of protein per 100 grams of food in both formulations and test whether they are equivalent within +/- 0.5 grams. You are not confident that the variances are equal, so you do not check Assume equal Variances in the Options subdialog box.
1 Open the worksheet CATFOOD.MTW.
2 Choose Stat > Equivalence Tests > 2-Sample.
3 Choose Samples in different columns.
4 In Test sample, enter Discount.
5 In Reference sample, enter Original.
6 From Hypothesis about, choose Test mean - reference mean.
7 From What do you want to determine, choose Lower limit < test mean - reference mean < upper limit.
8 In Lower limit, enter -0.5. In Upper limit, enter 0.5.
9 Click OK.
Session window output
Two-Sample Equivalence Test: Discount, Original
Method
Test mean = mean of Discount Reference mean = mean of Original Equal variances were not assumed for the analysis.
Descriptive Statistics
Variable N Mean StDev SE Mean Discount 10 33.971 0.58064 0.18361 Original 9 34.092 0.26138 0.087127
Difference: Mean(Discount) - Mean(Original)
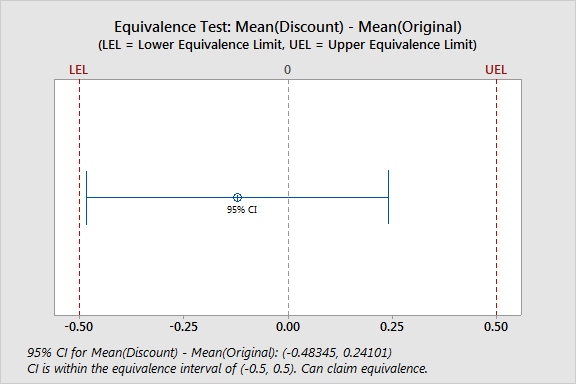
Difference SE 95% CI Equivalence Interval -0.12122 0.20324 (-0.48345, 0.24101) (-0.5, 0.5)
CI is within the equivalence interval. Can claim equivalence.
Test
Null hypothesis: Difference ≤ -0.5 or Difference ≥ 0.5 Alternative hypothesis: -0.5 < Difference < 0.5 α level: 0.05
Null Hypothesis DF T-Value P-Value Difference ≤ -0.5 12 1.8637 0.044 Difference ≥ 0.5 12 -3.0566 0.005
The greater of the two P-Values is 0.044. Can claim equivalence. |
Graph window output

For the cat food data, the confidence interval for the difference is completely within the equivalence interval. Thus you can conclude that the two formulations of cat food contain equivalent amounts of protein.