
Analyze Factorial Design
Residual plots - Histogram of the Residuals
![]()
![]()
![]()
|
|
Analyze Factorial DesignResidual plots - Histogram of the Residuals |
|
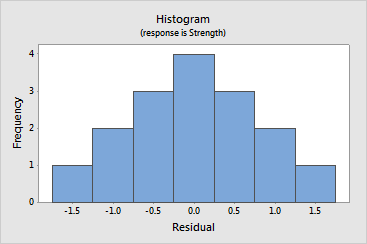
A histogram of the residuals shows the distribution of the residuals for all observations. Use the histogram as an exploratory tool to learn about the following characteristics of the data:
The histogram of the residuals should be bell-shaped. Use this plot to look for the following:
|
This pattern... |
Indicates... |
|
Long tails |
|
|
A bar far away from the other bars |
An outlier |
Because the appearance of the histogram can change depending on the number of intervals used to group the data, use the normal probability plot and goodness-of-fit tests to assess whether the residuals are normal.
Example Output |
|
Interpretation |
|
For the insulation data, no evidence of skewness or outliers exists.