|
|
Plot Mixture DesignMixture Response Plots - Response Trace Plot |
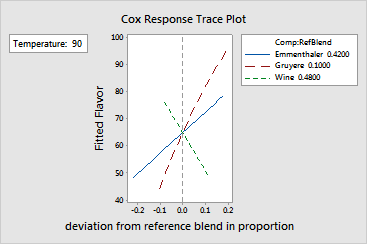
A response trace plot (also called a component effects plot) shows how each component affects the response relative to a reference blend. If the design contains process or amount variables, they must be held at a fixed level.
Example Output |

Interpretation |
The fondue data has three components and one process variable. Previous
investigation has shown that the fondue tastes the best when it is served
at 90
The trace plot provides the following information about the component effects. Starting at the location corresponding to the reference blend:
As the proportion of Emmenthaler in the mixture:
As the proportion of Gruyere in the mixture:
As the proportion of white wine in the mixture:
Based on these findings, you may want to increase the proportion of both Emmenthaler and Gruyere cheese, and decrease the proportion of wine in the fondue.