
Analyze Taguchi Design
Graphs - Interactions Plot
![]()
![]()
![]()
|
|
Analyze Taguchi DesignGraphs - Interactions Plot |
|
Taguchi designs traditionally focus on main effects, but it is important to test suspected interactions. Use the interactions plots to determine whether the effect of one factor on a response characteristic depends on the level of another factor.
Minitab creates the interactions plot by plotting for two factors the characteristic average for each combination of factor levels. So, for two factors with two levels each, four points would be plotted representing the four possible combinations. The levels of one factor are indicated on the horizontal axis, while the levels of the other factor are indicated by different colored lines and symbols.
You must consider the interactions when evaluating how changing one factor will affect the response.
Example Output |
|
Interpretation |
|
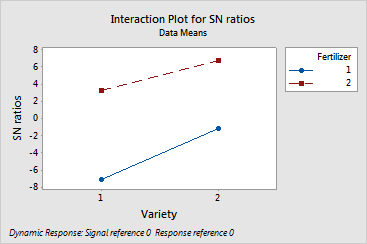
For the basil data, the analysis of variance tables indicate that the interactions between variety and fertilizer are not significant for any of the response characteristics. You should consider that fact when reviewing the interaction plots. On the plots, the solid line represents Variety 1 and the dashed line represents Variety 2. The interaction plot for the signal-to-noise ratio is shown.
For S/N ratios, the lines are almost parallel. Variety 2 has a higher S/N ratio than Variety 1 using both Fertilizer 1 and 2. With Variety 2, Fertilizer 2 produces a higher S/N ratio than Fertilizer 1.