|
|
Acceptance Sampling by Variables - CompareGraphs - Acceptance Region Plot |
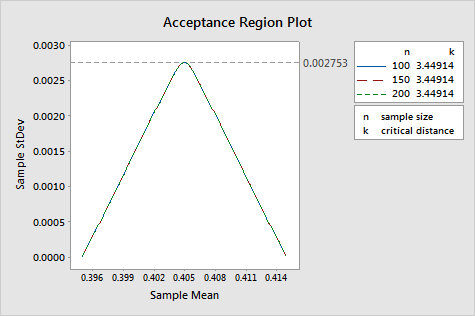
When both specifications are given and the standard deviation is unknown, this plot allows you to see the acceptance region (center triangle) of sample means and sample standard deviations for which you will accept a particular lot.
If the critical distance increases, the maximum standard deviation decreases and the acceptance region is smaller. If the critical distance decreases, the maximum standard deviation increases and the acceptance region is larger.
Example Output |

Interpretation |
|
For the camera data, the acceptance region representing the 3 sampling plans are identical and are the same as the original plan calculated for 259 lenses. The acceptance region is between 0.395 and 0.415 for the sample means (which are the lower and upper specifications) and extends to 0.002753 or the maximum standard deviation. Because the specifications are the same and the critical distance has not changed, the acceptance region is the same.