|
|
Acceptance Sampling by Variables - CompareGraphs - Operating Characteristic (OC) Curve |
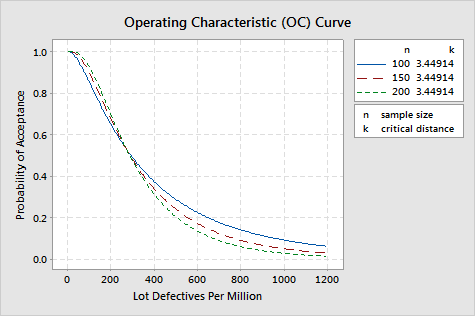
This plot allows you to see the probability of acceptance at various incoming quality levels.
Example Output |

Interpretation |
|
For the camera data, the three curves representing the three sampling plans are located slightly farther to the right than the original plan with a sample size of 259 lenses. As the sample size decreases (curve moves to the right), a greater probability exists of accepting a poor quality lot than with the original plan.
From the plot, large sample size gives a higher acceptance probability when the lot quality is good and a smaller acceptance probability when the lot quality is poor, compared with smaller sample sizes.