|
|
Type 1 Gage StudyGraphs - Basic Statistics |
The basic statistics consist of a summary of the measurement data including:
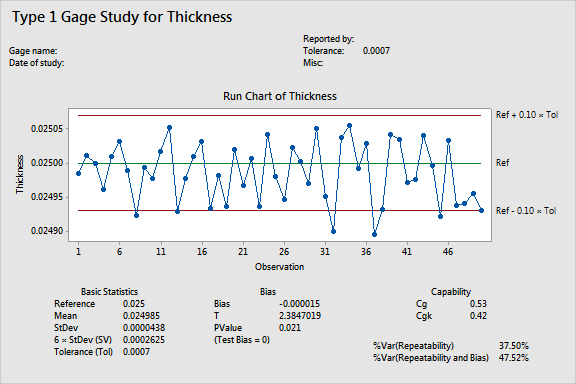
These statistics give an overall characterization of your measurements. It is helpful to see how close your mean is to the reference value and how large the standard deviation is.
Example Output |

Interpretation |
|
For the thickness data, the mean value (0.024985) is slightly lower than the reference value (0.025), and the standard deviation (0.0000438) is small; however, the tolerance (0.0007) is also very small, which leaves little room for variation in measurements.