|
|
Type 1 Gage StudyGraphs - Bias |
The bias statistics consist of:
These values indicate whether you have significant bias in your measurements.
Example Output |

Interpretation |
|
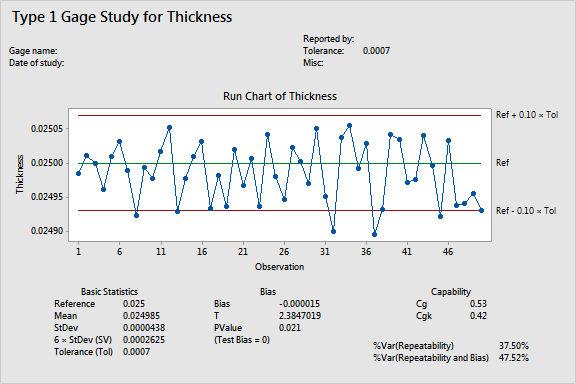
For the thickness data, the p-value is 0.021, which indicates that the null hypothesis for the test of bias=0 must be rejected.
There is significant bias present in the measurement system, even though the value seems small (-0.000015).