|
|
Capability Sixpack - NormalGraphs - Capability Plot |
The Capability Plot is located in the lower center of the Capability Sixpack - Normal.
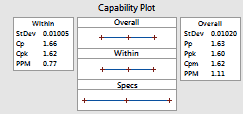
The capability plot consists of three intervals:
Compare the within and overall intervals to the specifications interval. If the within and overall intervals are contained within the specification intervals, then you can conclude that the process is producing units that conform to specifications.
Example Output |

Interpretation |
For the piston data, the within and overall intervals are contained well within the specification interval, implying that at least 99.74% of the measurements are within the specification interval.