
Capability Sixpack - Normal
Graphs - Normal Probability Plot
![]()
![]()
![]()
|
|
Capability Sixpack - NormalGraphs - Normal Probability Plot |
|
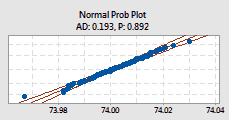
The Normal Prob Plot is located in the middle right side of the Capability Sixpack - Normal.
Use the normal probability plot to assess whether the data are normally distributed. If the data are normally distributed, the plotted points should appear close to a straight line and within the 95% confidence interval. Also, use Anderson-Darling test statistics with corresponding p-values to assess if your data follows a distribution.
Example Output |
|
Interpretation |
|
For the piston data, the plotted points fall in an approximately straight line and within the 95% confidence interval. Also, the Anderson-Darling statistics (0.193) and p-value (0.892) suggests that the data are normally distributed.