|
|
Capability Sixpack - Between/WithinGraphs - Capability Plot |
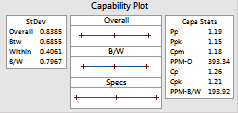
The Capability Plot is located in the lower right corner of the Capability Sixpack - Between/Within.
The capability plot consists of three intervals:
Compare the B/W and overall intervals to the specification interval. For a capable process, the B/W and overall intervals should be narrower than the specification interval and centered at the target or center of the specifications.
Example Output |

Interpretation |
For the coating data, the B/W and overall intervals are contained within the specification interval, implying that at least 99.74% of the measurements are within the specification interval.