|
|
Zone ChartGraphs - Zone Chart |
The zone chart consists of the following:
- between the average (center line) and 1 s, with a zone weight of 0
- between 1 and 2 s, with a zone weight of 2
- between 2 and 3 s, with a zone weight of 4
- beyond 3 s, with a zone weight of 8
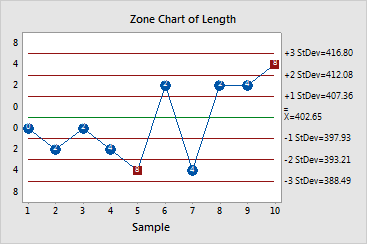
Examine the zone chart to see if any cumulative scores, which are located in the circles plotted on the chart, are greater than 8. The zone chart also displays the process average and s levels on the right Y-axis.
Example Output |

Interpretation |
For the steel bar length data, subgroup 5 with a cumulative score of 8, and subgroup 10 with a cumulative score of 8, signal that the manufacturing process is out of control.
The average steel bar length is 402.65. Steel bar lengths are expected to average between 416.80 (-3 StDev limit) and 388.49 (+3 StDev limit).
Because the steel bar process is out-of-control, the amount of variation (388.49 - 416.80) for the steel bar manufacturing process could be larger than what should be expected under normal conditions. You should investigate possible causes and solutions for the out-of-control signals to obtain accurate estimates of process performance.