|
|
Analysis of MeansGraphs - Analysis of Means for Poisson Data |
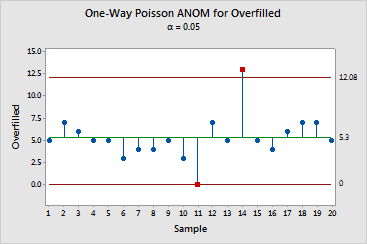
Use ANOM with Poisson data to identify unusual observations. It tests the hypothesis that all the observations come from the same Poisson distribution at the a-level you specify.
The ANOM plot for Poisson data consists of the following:
- If a sample value is located beyond a decision limit, you can reject the hypothesis that the value is equal to the mean.
- If a sample value falls within the decision limits, you cannot reject the hypothesis that the value is equal to the mean.
|
Note |
Because ANOM uses a normal approximation with Poisson data, the mean of the Poisson distribution should be at least five. |
Example Output |

Interpretation |
|
For the packing data, Minitab identifies machine 11 as having an unusually small overfill count (0). Therefore, machine 11 is working effectively because you want machines to have low overfill counts.
Minitab identifies machine 14 as having an unusually large overfill count (13), suggesting that you should inspect this machine.