
Analysis of Means
Graphs - Analysis of Means for Binomial Data
![]()
![]()
![]()
|
|
Analysis of MeansGraphs - Analysis of Means for Binomial Data |
|
Use ANOM with binomial data to identify unusually large or small proportions. It tests the hypothesis that all the proportions come from the same binomial distribution at an a-level you specify.
With binomial data, a sample consists of observations that are either a "success" or "failure." All samples must be of the same size.
The ANOM plot for binomial data consists of the following:
- If a sample proportion is located beyond a decision limit, you can reject the hypothesis that the proportion is equal to the overall proportion.
- If a sample proportion falls within the decision limits, you cannot reject the hypothesis that the proportion is equal to the overall proportion.
|
Note |
Because ANOM uses a normal approximation with binomial data, both np and n(1-p) should be at least five. |
Example Output |
|
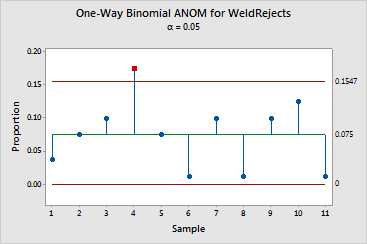
Interpretation |
|
For the weld data, 11 samples of 80 welds each were taken. In each sample, the number of welds that did not meet specifications was recorded. Minitab divides the number of defective welds by 80 to obtain the proportion of defective welds.
Sample 4 is identified as being unusually large. Sample 4 had 14 defective welds, whereas all other samples had 10 or fewer.