|
|
Analysis of MeansGraphs - Unbalanced One-Factor Design |
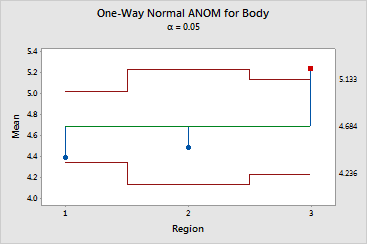
Use the ANOM main effects plot to test the hypothesis that each factor level mean is equal to the overall mean at an a-level you specify. Minitab displays one main effect plot for each factor in a two-way design. The main effects plot shows the following:
- If a sample mean is located beyond a decision limit, you can reject the hypothesis that the mean is equal to the overall mean.
- If a sample mean falls within the decision limits, you cannot reject the hypothesis that the mean is equal to the overall mean.
Minitab calculates decision limits separately for each level in an ANOM for an unbalanced one-factor design. The limits for a factor level depend on the number of observations at that level.
- When all levels have the same number of observations, the decision limits are straight lines.
- When the levels do not all have the same number of observations, then the decision limits change with the level.
Levels that have many observations have decision limits that are closer to the center line than those that have fewer observations.
Example Output |

Interpretation |
|
For the wine data, the graph shows the following: