|
|
Analysis of MeansGraphs - Interactions in a Two-Factor Design |
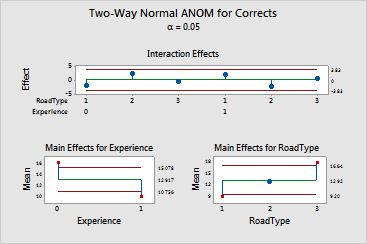
Use the ANOM interactions plot to test the hypothesis that there is no interaction between the factors in a two-way design at an a-level that you specify. The interactions plot shows the following:
- If one or more effects are beyond the decision limits, then you reject the hypothesis and conclude that there is statistical evidence of an interaction. Examining which cells are beyond the decision limits may help you to interpret the interaction.
- If no effects are beyond the decision limits, then you cannot reject the hypothesis. There is no statistical evidence of an interaction.
Example Output |

Interpretation |
|
For the driving values, none of the effects are beyond the decision limits, so no evidence of an interaction exists.