|
|
Display Descriptive StatisticsGraphs - Individual Value Plot |
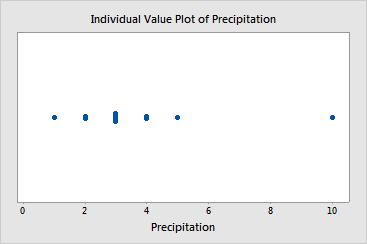
Use the individual value plot to examine the dispersion and concentration of the data. Each circle represents one observation.
If you choose to group data with a By variable, Minitab will orient the plot vertically. Otherwise, the plot will be oriented horizontally.
Example Output |

Interpretation |
|
In the individual value plot of the precipitation data set, notice that all but one of the dots is between 1 and 5.