|
|
One-Sample Equivalence TestGraphs - Individual Value Plot |
Individual value plots illustrate the following properties of your data:
Example Output |

Interpretation |
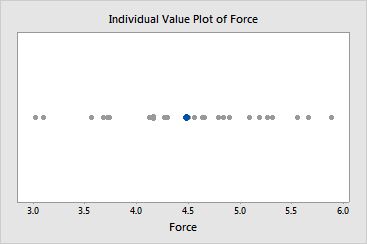
The individual value plot of the snack bag data indicates that there are no outliers.