|
|
One-Sample Equivalence TestGraphs - Histogram |
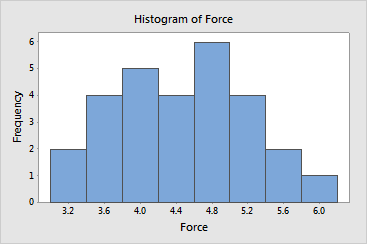
Use the histogram to view the distribution of the sample data. You should investigate any extreme values or differences that appear to deviate significantly from normality.
Example Output |

Interpretation |
The histogram of the snack bag data indicates that the data are approximately normally distributed and that there are no outliers.