|
|
Binary Logistic RegressionResidual Plots - Normal plot of the Residuals |
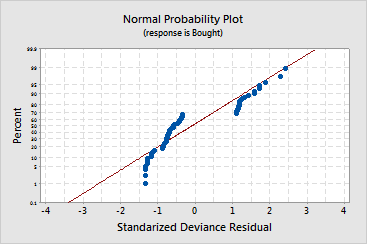
This graph plots the residuals versus their expected values when the distribution is normal. The residuals from the analysis should be approximately normally distributed. In practice, for data with a large number of observations, moderate departures from normality do not seriously affect the results.
When the data are in event/trial format, the normal probability plot of the residuals should roughly follow a straight line. Use this plot to look for the following:
|
This pattern... |
Indicates... |
|
Not a straight line |
|
|
Curve in the tails |
|
|
A point far away from the line |
An outlier |
|
Changing slope |
If your data have fewer than 50 observations, the plot may display curvature in the tails even if the residuals are normally distributed. As the number of observations decreases, the probability plot may show even greater variation and nonlinearity. Use the normal probability plot and goodness-of-fit tests to assess the normality of residuals in small data sets.
Example Output |

Interpretation |
|
For the cereal data, one group of residuals is most frequent around -0.75 and the second group is most frequent around 1.25. The lower group does not follow the line. This pattern often means not enough data is in the set for normal approximation theory to apply. Confidence intervals for predictions are probably inaccurate.
Two observations have standardized deviance residuals that are greater in absolute value than 2.