|
|
Binary Logistic RegressionResidual Plots - Three-in-One Residual Plot |
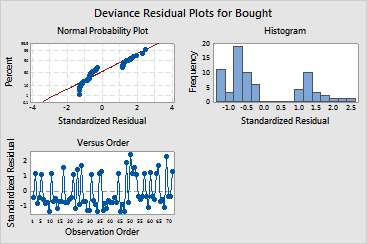
The three-in-one residual plot displays three different residual plots together in one graph window. This layout can be useful for comparing the plots to determine whether your model meets the assumptions of the analysis. The residual plots in the graph include:
Example Output |

Interpretation |
|
To view the interpretation of each residual plot in the three-in-one plot, refer to the individual topic for each residual plot preceding this topic.