|
|
Binary Logistic RegressionResidual Plots - Residuals versus variables |
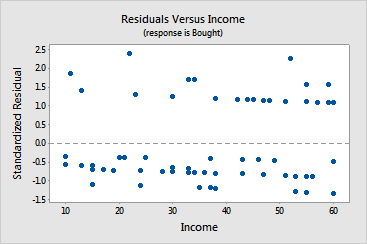
This graph plots the residuals versus another variable. The residuals should fluctuate in a random pattern around the center line. If the variable is already included in the model, use the plot to determine if you should add a higher-order term of the variable. If the variable is not already included in the model, use the plot to determine if the variable is influencing the response in a systematic way.
Use this plot to look for the following:
|
This pattern... |
Indicates... |
|
Pattern in residuals |
The variable is influencing the response in a systematic way |
|
Curvature in the points |
The model needs a higher-order term of the variable or a different link function |
Example Output |

Interpretation |
|
For the cereal data, no patterns are apparent in the plot against the Income predictor. The two observations with large standardized residuals are visible again. The potential outliers come from different income levels, so income does not explain why the outliers occur.