|
|
Partial Least SquaresModel Evaluation Plots - Model Selection Plot |
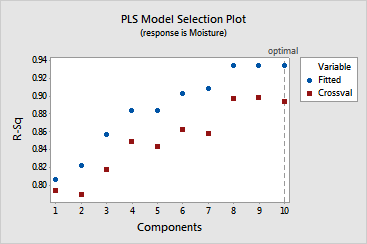
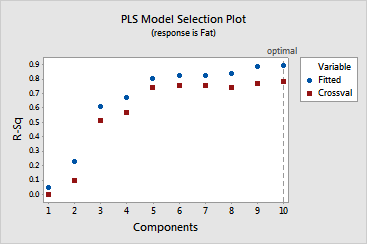
The model selection plot is a scatterplot of the R-squared
and predicted R-squared
values as a function of the number of components extracted or cross-validated.
It is a graphical display of the Model Selection and Validation table.
The vertical line indicates the number of components Minitab selected
for the PLS model. If you do not use cross-validation, the predicted R![]() values do not appear on your plot. Minitab provides one model
selection plot per response.
values do not appear on your plot. Minitab provides one model
selection plot per response.
Use this plot to compare the modeling and predicting power of different models to determine the appropriate number of components to retain in your model.
Example Output |


Interpretation |
In this example, the PLS model selected has 10 components, indicated
by the vertical lines on both plots. The average predicted R![]() value for the responses is maximized with 10 components.
value for the responses is maximized with 10 components.