|
|
Partial Least SquaresModel Evaluation Plots - Response Plot |
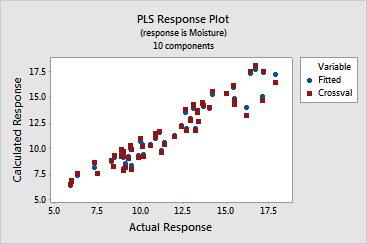
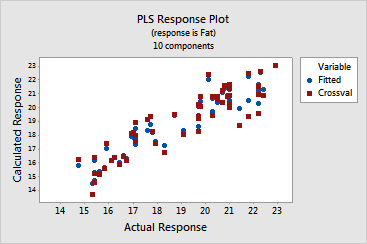
The response plot is a scatterplot of the fitted and cross-validated fitted values versus the actual responses. If you do not use cross-validation, the cross-validated fitted values do not appear on your plot. Minitab provides one response plot per response.
This plot shows how well your model fits and predicts each observation. When examining this plot, look for:
Example Output |


Interpretation |
In this example, the plots for moisture and fat do not reveal differences between the fitted and cross-validated fitted responses. The points on both plots are in a linear pattern, indicating that the model fits the data well and accurately predicts the response.