|
|
Partial Least SquaresComponent Evaluation - X-Residual Matrix Plot |
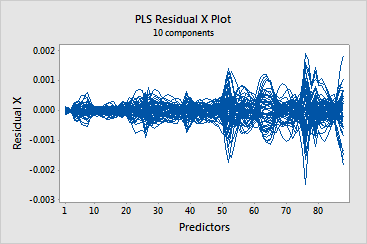
The residual X plot is a line plot of the x-residuals versus the predictors. Each line represents an observation and has as many points as it has predictors. Use the x-residual matrix plot to identify observations or predictors that the model describes poorly. This plot is most useful with predictors that are on the same scale.
Ideally, the lines on the plot should be close together and near zero.
Use the x-residual matrix plot to see general patterns in the residuals and identify areas where problems exist. Then, examine the x-residuals displayed in the output to pinpoint which observations and predictors the model describes poorly.
Example Output |

Interpretation |
|
In this example, the residuals are close to zero, which indicates that your model describes most of the variance in the predictors. With such small x-residual values, you cannot detect observations or predictors that the model does not describe well.