|
|
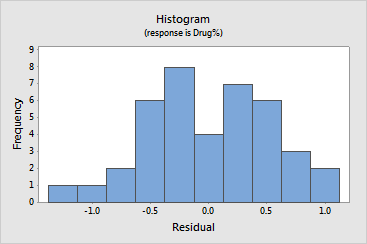
Stability StudyResidual Plots - Histogram of the Residuals |
A histogram of the residuals shows the distribution of the residuals for all observations. Use the histogram as an exploratory tool to learn about the following characteristics of the data:
The histogram of the residuals should be approximately normal or bell-shaped. Use this plot to look for the following:
|
This pattern... |
Indicates... |
|
Long tails |
|
|
A bar far away from the other bars |
An outlier |
Because the appearance of the histogram can change depending on the number of intervals that are used to group the data, use the normal probability plot and the goodness-of-fit test to assess whether the residuals are normal.
If batch is a random factor, and the final model includes the batch by time interaction, then the variance of the marginal residuals depends on the time variable and may not be constant. You can use the conditional residuals to check the normality of the error term in the model.
Example Output |

Interpretation |
For the pill data, the residuals appear to be reasonably normal.