|
|
One-Sample Equivalence TestPower and Sample Size |
For a 1-sample equivalence test, power is the ability to establish that the test mean is equivalent to your target value. In other words, power is the probability that you will conclude that the difference between the test mean and the target value is within your equivalence limits, when this is in fact true. See Power for equivalence tests for further discussion.
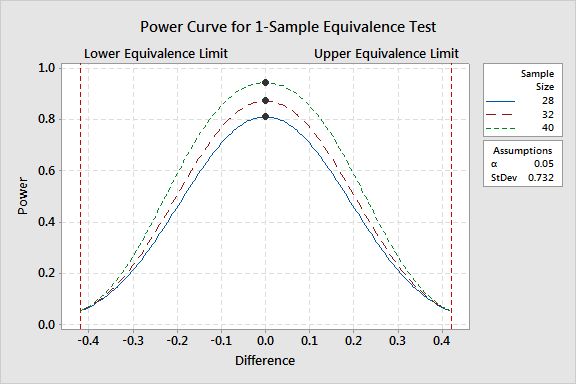
If you specify the sample size and the difference, Minitab displays a power curve that shows the relationship between power and the difference for each sample size. Each power curve includes a symbol for each difference value that you specify.
Example Output |

Interpretation |
The power curve for the snack bag analysis shows that the power is greatest when the difference is halfway between the equivalence limits. The equivalence limits are -0.42 and 0.42, so the midpoint between the limits is 0. As the difference approaches the lower equivalence limit or the upper equivalence limit, the power of the test decreases and approaches a, which is 0.05 for this analysis.
The Session window output provides additional details about the parameters for the analysis.