|
|
One-Sample Equivalence TestPower and Sample Size |
Increasing the sample size increases the power of your test. (See Power for equivalence tests for further discussion.) You want enough observations in your sample to achieve adequate power, but not so many that you waste time and money on unnecessary sampling.
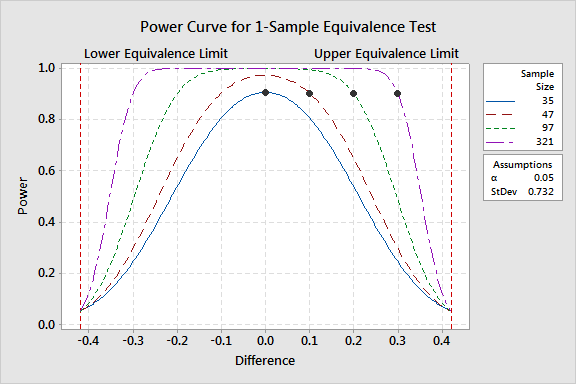
If you specify the power and the difference, Minitab displays a power curve that shows the sample size that is required to achieve the specified level of power. Each power curve shows the relationship between power and the difference for that sample size.
Example Output |

Interpretation |
The power curve for the snack bag analysis shows that, if the difference is 0, then you need 35 observations to achieve a power of 0.9. With more observations, you can accommodate greater differences and still have power to claim equivalence. For example, with 321 observations, you have a power of at least 0.9, even if the difference is as large as 0.3.
For any sample size, the power of the test decreases and approaches a as the difference approaches the lower equivalence limit or the upper equivalence limit.
The Session window output provides additional details about the parameters for the analysis.