|
|
One-Sample Equivalence TestPower and Sample Size |
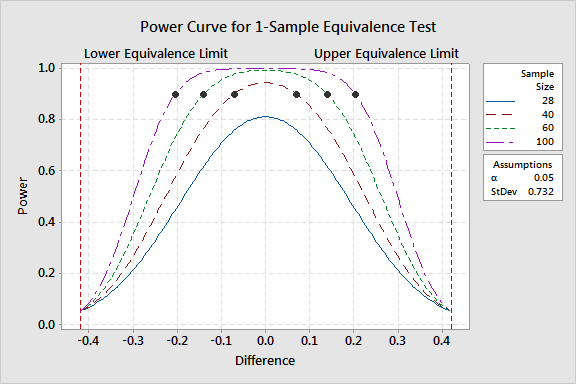
If you specify the sample size and the power that you want to achieve, Minitab displays a power curve with symbols to indicate the maximum differences for which you can achieve the desired level of power. For larger sample sizes, the difference can be closer to your equivalence limits. If the specified level of power cannot be achieved, then no symbol is shown.
Example Output |

Interpretation |
The snack bag analysis shows that, with 28 observations, you cannot achieve a power of 0.9 to claim equivalence, regardless of the difference. The analysis also shows the following:
The Session window output provides additional details about the parameters for the analysis.