|
|
One ProportionPower and Sample Size |
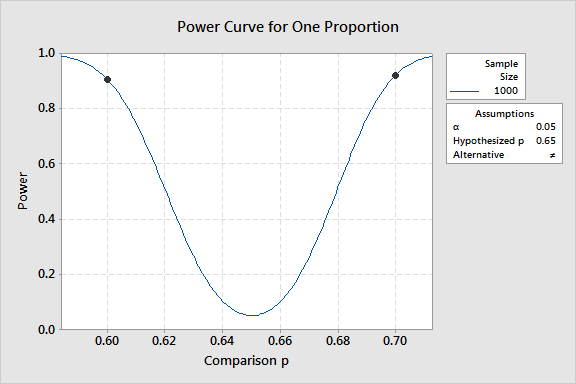
Use the power curve to help you choose the appropriate sample size or power for your test. This power curve plots the power of the test versus the comparison proportion. If you provide the size of your sample and the comparison proportion you want to detect, Minitab calculates the power of the test.
Example Output |

Interpretation |
|
For the advertisement data, the power curve represents every combination of power and comparison proportion based on a sample of size 1000. The symbols on the power curve represent the calculated power of 0.906457 and 0.920779 for comparison proportions of 0.6 and 0.7, respectively.