|
|
One ProportionPower and Sample Size |
If you provide the sample size and the power that you would like your test to have, Minitab calculates the comparison proportion that the test can detect.
Example Output |

Interpretation |
|
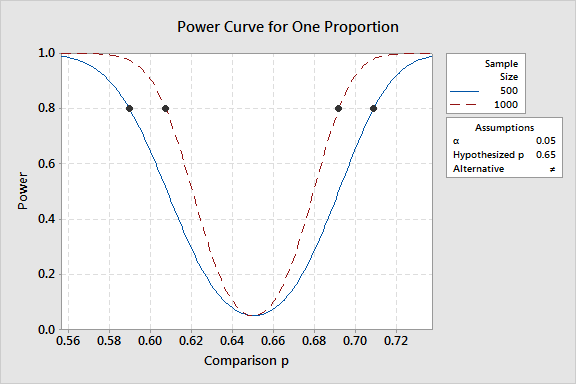
For the advertisement data, the graph displays one power curve for each sample size. The power curves represent every combination of power and comparison proportions the test can detect based on a sample sizes of 500 and 1000. As the sample size increases, and the other assumptions are held constant, the test can detect smaller differences between the hypothesized proportion and comparison proportion while maintaining the same level of power at 0.80.