main topic interpreting results session command see also
Suppose you work for a wire manufacturer and are concerned about the effectiveness of the wire insulation process. You take random lengths of electrical wiring and test them for weak spots in their insulation by subjecting them to a test voltage. You record the number of weak spots and the length of each piece of wire (in feet).
1 Open the worksheet BPCAPA.MTW.
2 Choose Stat > Quality Tools > Capability Analysis > Poisson.
3 In Defects, enter Weak Spots.
4 In Uses sizes in, enter Length. Click OK.
Graph window output

Session window output
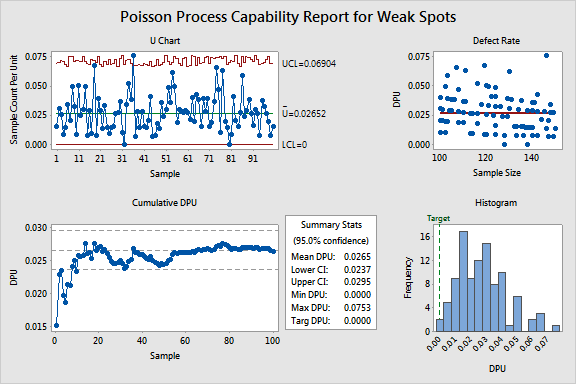
Poisson Process Capability Report for Weak Spots
Test Results for U Chart of Weak Spots
TEST 1. One point more than 3.00 standard deviations from center line. Test Failed at points: 36 |
The U Chart indicates that there is one point out of control. The chart of cumulative DPU (defects per unit) has settled down around the value 0.0265, signifying that enough samples were collected to have a good estimate of the mean DPU. The rate of DPU does not appear to be affected by the lengths of the wire.