main topic interpreting results session command see also
Suppose you are interested in the capability of a process that coats rolls of paper with a thin film. You are concerned that the paper is being coated with the correct thickness of film and that the coating is applied evenly throughout the roll. You take three samples from 25 consecutive rolls and measure coating thickness. The thickness must be 50 + 3 mm to meet engineering specifications.
Because you are interested in determining whether or not the coating is even throughout a roll, you use Minitab to conduct a Capability Sixpack (Between/Within).
1 Open the worksheet BWCAPA.MTW.
2 Select Stat > Quality Tools > Capability Sixpack > Between/Within.
3 In Single column, enter Coating. In Subgroup size, enter Roll.
4 In Lower spec, enter 47. In Upper spec, enter 53.
5 Click Tests. Choose Perform all eight tests. Click OK in each dialog box.
Graph window output

Session window output
I-MR-R/S Standard Deviations of Coating
Standard Deviations
Between 0.683918 Within 0.413949 Between/Within 0.799435 |
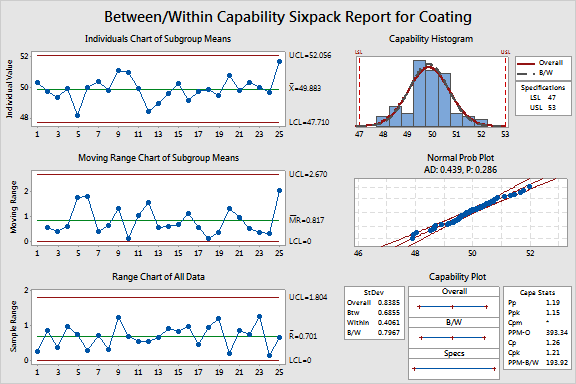
If you want to interpret the process capability statistics, your data need to come from a normal distribution. This criteria appears to have been met: in the capability histogram, the data approximately follow the normal curve; also, on the normal probability plot, the points approximately follow a straight line, and fall within the 95% confidence interval.
No points failed the eight tests for special causes, thereby implying that your process is in control. The points on the Individuals and Moving Range chart do not appear to follow each other, again indicating a stable process.
The capability plot shows that the process is meeting specifications. The values of Cpk (1.21) and Ppk (1.15) fall just below the guideline of 1.33, so your process could use some improvement.
The standard deviation estimates that are displayed in the Session window are for the control charts. These estimates are likely to be different from those used to calculate the capability statistics.