main topic interpreting results session command see also
Suppose you work for a company that manufactures floor tiles, and are concerned about warping in the tiles. To ensure production quality, you measured warping in 10 tiles each working day for 10 days. Johnson transformation is helpful when the collected data are nonnormal, but one desires to apply a methodology that requires the underlying distribution to be normal.
Because your data is highly right-skewed, you want to transform it so the data follow a normal distribution. Use Johnson transformation to select the best transformation.
|
Note |
You can set preference for Y-scale type, graph orientation, and a method for calculating the plot points using Tools > Options > Individual Graphs > Probability Plots. |
1 Open the worksheet TILES.MTW.
2 Choose Stat > Quality Tools > Johnson Transformation.
3 Under Data are arranged as, choose Single column; then enter Warping.
4 Under Store transformed data in, choose Single column; then enter C2.
5 Click Options.
6 In P-Value to select best fit, enter 0.05. Click OK in each dialog box.
Graph window output

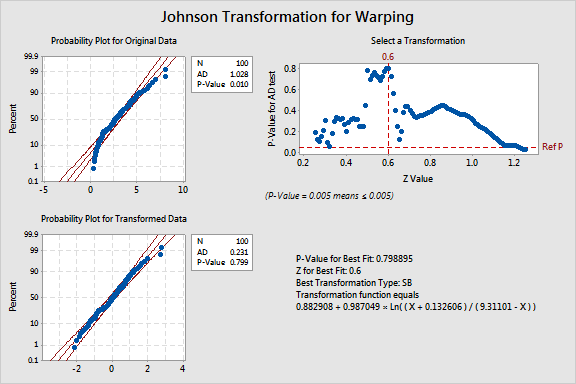
original data indicates that the data do not follow a normal distribution (AD = 1.028, P = 0.01).
transformed data indicates that the data follow a normal distribution (AD = 0.2310, P = 0.799).
|
More |
You can compare the normality of the transformed data stored in C2 to the original data, using Stat > Basic Statistics > Normality Test. For example of Box-Cox transformation using this data, see Example of Capability Analysis using a Box-Cox transformation. |