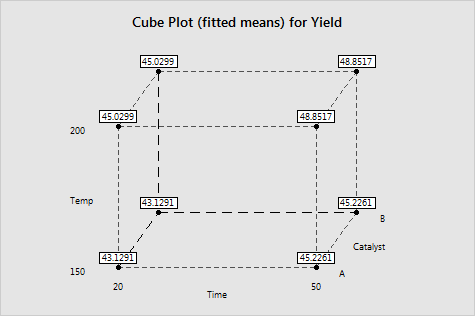
In the Example of analyzing a full factorial design with replicates and blocks, you were investigating how processing conditions (factors) - reaction time, reaction temperature, and type of catalyst - affect the yield of a chemical reaction. You determined that there was a significant interaction between reaction time and reaction temperature and you would like to view the cube plot to help you understand the nature of the relationship.
You do not need to re-analyze that model. The worksheet contains the model for the factorial plots.
1 Open the worksheet YIELDPLT.MTW.
2 Choose Stat > DOE > Factorial > Cube Plot.
3 In Response, choose Yield.
4 In Variables
to Include in Plots, click ![]() to
include Time, Temp,
and Catalyst. Click OK.
to
include Time, Temp,
and Catalyst. Click OK.
Graph window output

The cube plot indicates that reaction time and reaction temperature interact to affect the response.
When the time increases from the low level to the high level and temperature is low, the increase in yield is about 2.1. When the temperature increases and the time is low, the increase in yield is about 1.9.
Because the model has the interaction between time and temperature, the effects are different when the variables are at their high levels. When time increases and temperature is high, the increase in yield is about 3.8. When the temperatures increases and the time is high, the increase in yield is about 3.6.
Because catalyst is not in the model, moving from catalyst A to catalyst B on the cube does not show any change in yield.
Although you can use cube plots to compare the magnitudes of effects, be sure to evaluate significance by looking at the effects in an analysis of variance table or the normal or Pareto effects plots. See Example of analyzing a full factorial design with replicates and blocks.
These plots use a model equation. Ensure that your model is adequate before you interpret the plots.