main topic interpreting results session command see also
This overlaid contour plot is a continuation of the analysis for the plastic pipe experiment. The compound normally used to make a plastic pipe is made of two materials: Mat-A and Mat-B. As a research engineer, you would like to determine whether or not a filler can be added to the existing formulation and still satisfy certain physical property requirements. You would like to include as much filler in the formulation as possible and still satisfy the response specifications. The pipe must meet the following specifications:
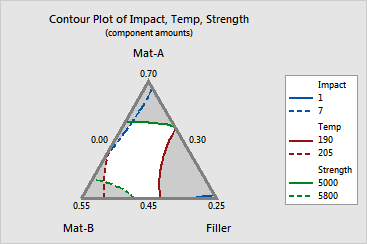
Using an augmented simplex centroid design, you collected data and are now going to create an overlaid contour plot for three responses: impact strength (Impact), deflection temperature (Temp), and yield strength (Strength).
1 Open the worksheet MIXOPT.MTW. (The design, response data, and model information have been saved for you. The data is from [1].)
2 Choose Stat > DOE > Mixture > Overlaid Contour Plot.
3 Click  to select
all available responses.
4 Click Contours. Complete the Low and High columns of the table as shown below:
|
Name |
Low |
High |
|
Impact |
1 |
7 |
|
Temp |
190 |
205 |
|
Strength |
5000 |
5800 |
5 Click OK in each dialog box.
Graph Window Output

The white area in the center of the plot shows the range of the three components, Mat-A, Mat-B, and Filler, where the criteria for all three response variables are satisfied.
You can use this plot in combination with the optimization plot to find the "best" formulation for plastic pipe.