main topic interpreting results session command see also
This contour plot is a continuation of the analysis for the heat-sealing process experiment. Parts are placed inside a sealable bag, which is then sealed with a heat-sealing machine. The seal must be strong enough so that product will not be lost in transit, yet not so strong that the consumer cannot open the bag. The upper and lower bounds for the seal strength are 20 and 32 pounds, with a target of 26 pounds.
Previous experimentation has indicated that the important factors for controlling the strength of the seal are: hot bar temperature (HotBarT), dwell time (DwelTime), hot bar pressure (HotBarP), and material temperature (MatTemp). Hot bar temperature (HotBarT) and dwell time (DwelTime) are important for reducing the variation in seal strength.
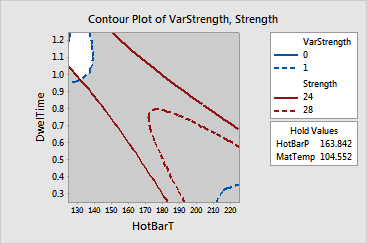
Your goal is to optimize both responses: strength of the seal (Strength) and variability in the strength of the seal (VarStrength). With an overlaid contour plot, you can only look at two factors at a time.
You do not need to re-analyze these regression models. The worksheet contains the models for the overlaid contour plot.
1 Open the worksheet RSOPT_MODEL.MTW.
2 Choose Stat > DOE > Response Surface > Overlaid Contour Plots.
3 Click ![]() to select
both available responses.
to select
both available responses.
4 Under Variables, in X Axis, choose HotBarT.
5 Under Variables, in Y Axis, choose DwelTime.
6 Under Display plot using, choose Uncoded units.
7 Click Contours. Complete the Low and High columns of the table as shown below, then click OK.
|
Name |
Low |
High |
|
VarStrength |
0 |
1 |
|
Strength |
24 |
28 |
8 Click Settings. In Setting, enter 163.842 for HotBarP and 104.552 for MatTemp.
9 Click OK in each dialog box.
Graph Window Output

The white area in the upper left corner of the plot shows the range of HotBarT and DwellTime where the criteria for both response variables are satisfied. You may increase or decrease the holding value to see the range change. To understand the feasible region formed by the three factors, you should repeat the process to obtain plots for all pairs of factors.
You can use the plots in combination with the response optimizer to find the best operating conditions to seal the bags.
This plot uses model equations. Ensure that your models are adequate before you interpret the plot.