main topic
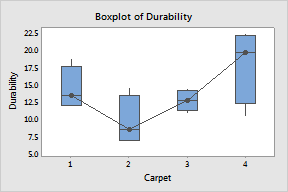
You can represent the data with different box types (interquartile range, median confidence interval, and range); outlier, individual, median and mean symbols; and median and mean connect lines. If you have grouping variables, you can assign different attributes to each group. In the Example of a boxplot with groups, you assess the durability of four experimental carpet products. You want to customize the data display.
|
Interquartile range box (default), median symbol, and median connect line 1 Open the worksheet CARPET.MTW. 2 Choose Graph > Boxplot. 3 Under One Y, choose With Groups, then click OK. 4 In Graph Variables, enter Durability. 5 In Categorical variables (1-4), enter Carpet. 6 Click Data View. 7 Check Outlier symbols, Median symbol, and Median connect line. 8 Click OK in each dialog box. |
| ||
|
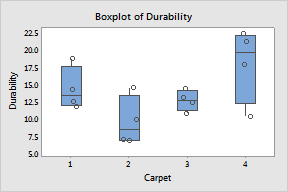
Interquartile range box and individual symbol 1 To recall the last dialog box, press [Ctrl]+[E]. 2 Click Data View. 3 Uncheck Median symbol and Median connect line. 4 Check Individual symbols. 5 Click OK in each dialog box.
|
| ||
|
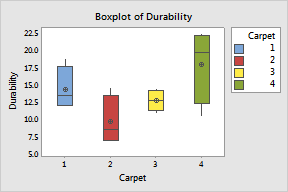
Interquartile range box, mean symbol, and a categorical variable for attribute assignment 1 Press [Ctrl]+[E]. 2 Click Data View. 3 Uncheck Individual symbols. 4 Check Mean symbol. 5 In Categorical variables for attribute assignment, enter Carpet. 6 Click OK in each dialog box. |
|