main topic
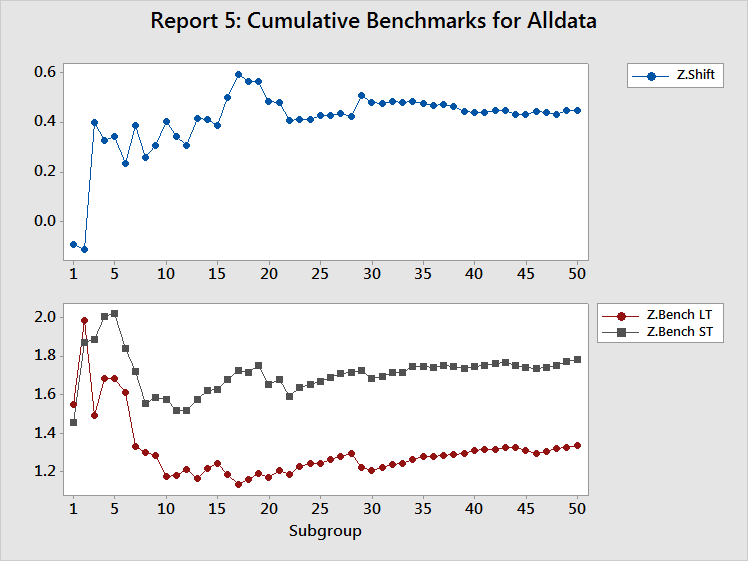
Displays the Z.Bench statistics (ST and LT) as well as the Z.Shift statistic after each subgroup.

The line on this plot should oscillate up and down on the left side, where there are few subgroups, but should stabilize on the right side if enough data have been collected and the process is stable.
Z.Shift is equal to the gap between Z.Bench LT and Z.Bench ST. Thus, both the gap in the Z.Bench plot and the line in the Z.Shift plot should approach a constant value, as they do in the example above.
The Z.Bench plot indicates whether you have collected enough data to confidently use these statistics to report process performance. Both lines on this plot should oscillate up and down on the left side, where there are few subgroups, but should stabilize on the right side if enough data have been collected and the process is stable. If the lines do not stabilize, the plots in Report 4 should help you determine whether the problem is not enough data or a process instability.
Both the gap in the Z.Bench plot and the line in the Z.Shift plot should approach a constant value, as they do in the example above.