main topic
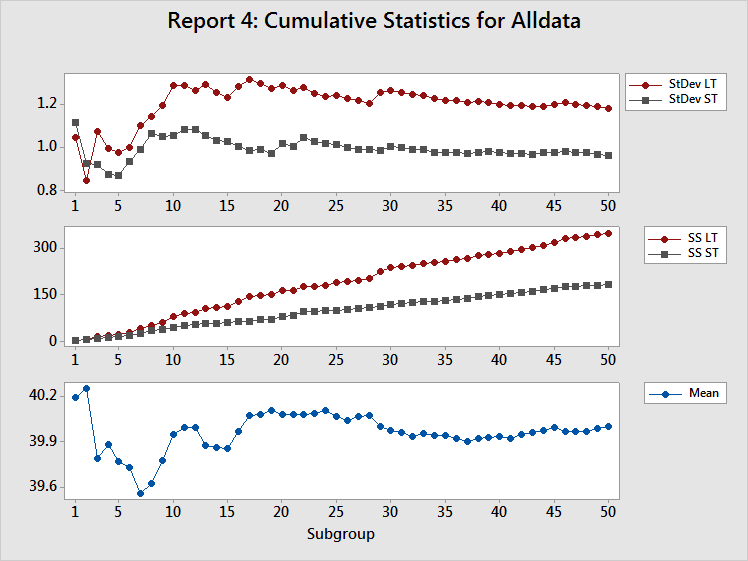
Includes three components that help check the assumption of a stable process (fairly constant mean and variance):

Displays the estimates of both LT standard deviation and ST standard deviation after each subgroup of data. Because all the measures of process performance are based on estimates of the standard deviation of the process, you should determine whether these estimates are appropriate. This depends on having a stable process (a process in which the inherent variability is not changing) and enough data to adequately characterize the process.
The LT and ST standard deviation estimates should oscillate quite a bit on the left side of the plot, where there are few subgroups. If the process is stable and you have collected enough data, they will settle down and stabilize on the right side of the plot. If the lines on the plot continue to oscillate, either you have not collected enough data or the process variation is unstable.
For a stable process, the gap between LT standard deviation and ST standard deviation should become fairly constant. If the process changes, such as a shift in the mean or a change in variation, the gap between LT standard deviation and ST standard deviation changes. See Using process reports to identify mean shifts and Using process reports to identify increase in process variability.
Displays both the sum of squared deviations (SS Total or SS LT) after each subgroup of data and the sum of all squared deviations within each subgroup (SS Within or SS ST) after each subgroup of data. See Calculating sums of squares
SS ST provides a very good diagnostic tool for detecting changes in the inherent variation of a process. If the inherent variation is stable, the SS Within for each subgroup would be about the same. Thus, the SS ST should increase by about the same amount for each subgroup, resulting in an SS ST line with a constant upward slope. Any change in the inherent variability of the process will show up as a change in the slope of the SS ST line.
SS Total is the sum of SS Within and SS Between, so SS Total is affected by the stability of both the process variance and the process mean. If both are stable, the contribution to SS Total would be about the same for each subgroup. Thus, the SS LT should increase by about the same amount for each subgroup, resulting in an SS LT line with a constant upward slope. Any change in the inherent variability of the process will show up as a change in the slope of the SS LT line.
A sudden change in the inherent process variability affects both SS Within and SS Between and therefore changes the slopes of both the SS ST and SS LT lines. Hence, a change in slope for both lines indicates a change in the inherent process variability.
A process mean shift affects SS Between but not SS Within and therefore changes the slope of the SS LT line but not of the SS ST line. Hence, a change in the slope of the SS LT line along with no change in the slope of the SS ST line indicates a shift in the process mean.
See Using process reports to identify mean shifts and Using process reports to identify increase in process variability.
Displays the estimate of the process mean after each subgroup. As for the Cumulative Standard Deviation plot, the adequacy of the estimate depends on the amount of data collected and the stability of the process.
The estimates should oscillate up and down quite a bit on the left side of the plot, where there are few subgroups. If the process is stable and you have collected enough data, the estimates should stabilize on the right side on the plot. If the lines continue to oscillate, either you have not collected enough data or the process mean is drifting dramatically. Look at the Cumulative Standard Deviation plot to determine whether the problem is not enough data; - LT and ST lines will also oscillate.