main topic
Includes four major components:

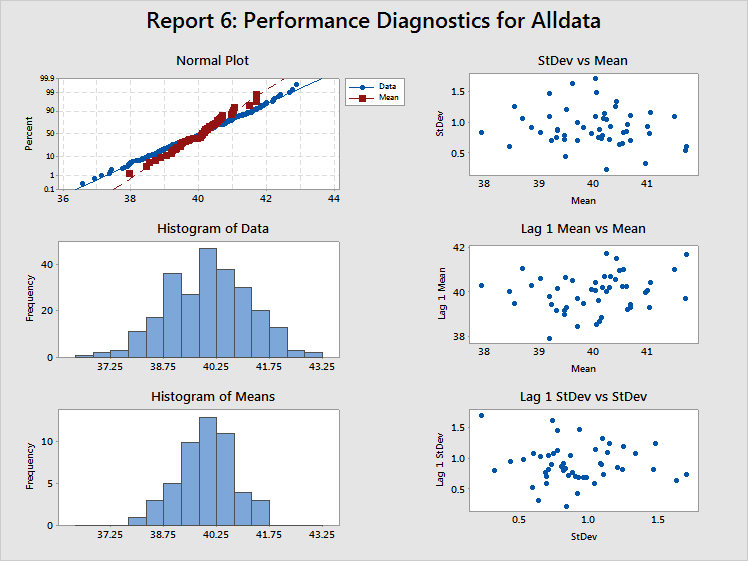
Estimates of the probability of a defect (such as DPMO) will not be accurate if the data are non normal. In most cases, these estimates tend to be lower than the actual values. So, check the normal plot and the two histograms to see whether the data are at least reasonably normal before using any estimates such as DPMO. The data in the example above appear to be normally distributed.
If the data appear badly skewed, try a transformation such as the Box-Cox, to correct the problem. When manually transforming the data, be sure to transform the target and specification limits as well. Minitab automatically transforms the data, the target, and specification limits when you choose Box-Cox under SixSigma > Process Report > Options.
When there is no correlation between subgroup means and subgroup standard deviations, this plot should display randomly scattered points, as in the example above.
If there is a positive correlation between the means and standard deviations, the subgroup standard deviations tend to increase as the subgroup means increase. The Box-Cox transformation (l = 0) is a well-known variance-stabilizing transformation that usually works well in these cases.
The plot of Lag 1 Mean vs Mean is a plot of (the mean for subgroup)i versus (the mean for subgroup)i-1. This plot should display randomly scattered points, as in the example above, to show no correlation between successive subgroup means.
If there is a positive correlation and one subgroup mean is larger than the overall process mean, then the next subgroup mean is also likely to be larger than the overall process mean. In other words, a positive correlation implies that the process is subject to drifting in the mean. If the correlation is negative, the mean of a subgroup is lower than the overall process mean, and it is highly likely that the mean of the next subgroup is also lower than the overall process mean. This negative correlation implies over control of the process.
The plot of Lag 1 StDev vs StDev is a plot of (the standard deviation for subgroup)i vs (the standard deviation for subgroup)i-1. This plot should display randomly scattered of points, as in the example above, to show no correlation between successive subgroup standard deviations.
As with the subgroup means, if there is a positive correlation and the standard deviation for a subgroup is larger than the average standard deviation for all subgroups, then the standard deviation for the next subgroup will most likely also be higher than the average standard deviation for all subgroups. Thus, subgroup standard deviations would tend to drift upward and downward. This could be accompanied by means that are also drifting upward and downward plus correlation between subgroup means and subgroup standard deviations. In this case, try using a Box-Cox transformation with l = 0.
Positive autocorrelation in the subgroup standard deviations could be caused by tool wear or other decay in the process (resulting in ever-increasing variation) or the presence of an uncontrolled nuisance factor that has an influence on variation (such as relative humidity).