|
|
Plot Mixture DesignDesign Space Plot - Simplex Design Plot |
Use a simplex design plot to visualize the mixture design space (or a slice of the design space if you have more than three components). Minitab plots the design points on triangular axes. You can plot the following:
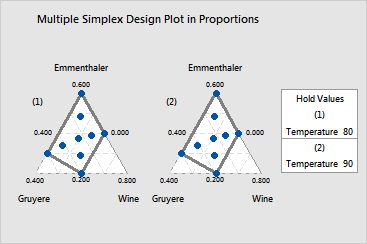
The display depends on whether the design contains process variables or an amount variable, and how you choose to handle these variables. You can display a plot that shows all the levels of these extra variables (as shown here) or just display a single plot.
Example Output |

Interpretation |
For the fondue data, a constrained extreme vertices design was chosen to investigate the effects of blend and serving temperature on flavor. Because there is one process variable (Temperature), a triangular plot is generated for each level of Temperature. The simplex design plot shows the shape of constrained design region and the 18 design points that are in this region. The points are as follows: