|
|
Plot Mixture DesignFactorial Plots - Main Effects Plot |
Use a main effects plot to visualize the effect of the process variables on the response and to compare the relative strength of the effects. Minitab draws a single main effects plot for one process variable, or a series of plots for two or more process variables.
Minitab plots the response means for each process variable level, then connects the points for each process variable. A reference line is drawn at the overall (grand) mean. Look at the line connecting the process variable levels to determine whether or not a main effect is present. You should only view the main effects plots for factors that are significant according to the estimated regression coefficients table from Analyze Mixture Design. A main effect is present when the change in the mean response across the levels of a factor is significant.
Remember that plots just indicate patterns. To determine if a pattern is statistically significant, you must do an appropriate test.
Example Output |

Interpretation |
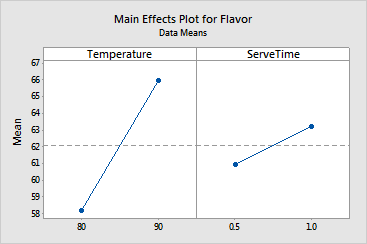
For the fondue data, the main effects plot indicates the following:
By comparing the slopes of the lines, you can compare the relative magnitude of the process variable effects. These plots show that serving temperature had a stronger effect than serving time on the flavor of the fondue.