|
|
Partial Least SquaresModel Evaluation Plots - Distance Plot |
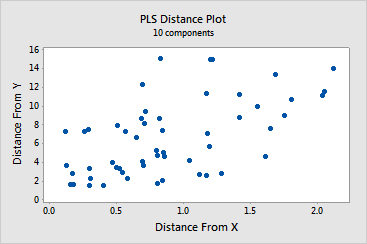
The distance plot is a scatterplot of each observation's distance from the x- and y-model. Distances from the y-model measure how well an observation is fitted in the y-space. Distances from the x-model measure how well an observation is fitted in the x-space.
When examining this plot, look for points with distances greater than other points on the x- or y-axis. Observations with greater distances from the y-model may be outliers and observations with greater distances from the x-model may be leverage points.
Example Output |

Interpretation |
|
In this example, several observations have greater distance values, identified by brushing the points: