see also
Acceptance sampling is the process of evaluating a sample of your incoming product to determine whether the entire lot (batch) should be accepted for use or rejected and sent back to the supplier. For example, suppose a grocer is receiving a shipment of 500 bushels of apples. He wants to examine a few apples to decide whether the entire shipment is acceptable for sale, or should be returned to the supplier. Acceptance sampling will help him determine how many apples to inspect and how many defectives are allowed while still accepting the shipment.
Acceptance sampling is useful when the cost of 100% inspection is much higher than the consequence of passing on defective product; however, acceptance sampling cannot give estimates of quality levels and does not offer any direct process control.
Use Acceptance Sampling by Attributes to either create a new sampling plan or to compare various plans.
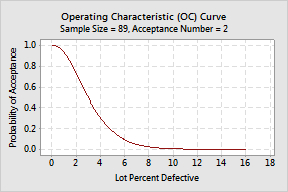
Attribute plans are generally easier to use than variables plans. A sample of n units is selected randomly from a lot of N units. If there are c or fewer defectives, accept the lot. If there are more than c defectives, reject the lot. For example, suppose you have a shipment of 10,000 bolts. You will inspect 89 of them. If there are 0, 1, or 2 defective bolts, then you may accept the shipment. If there are more than 2 defectives, then reject the entire lot of bolts.
Use Acceptance Sampling by Variables - Create / Compare to either create a new sampling plan or to compare various plans.
For a variables plan, you need to calculate the mean, standard deviation, and Z value based on actual measurements. Use Acceptance Sampling by Variables - Accept / Reject to perform calculations and sentence a lot based on particular sample data.
Also, for variables sampling plans, you can only examine one measurement per sampling plan. For example, if you need to inspect for wafer thickness and wafer width, you need two separate sampling plans. Variables sampling plans assume that the distribution of the quality characteristic is normal. However, the main benefit from using variables data is that a variables sampling plan requires a much smaller sample size than an attributes sampling plan.
Because we are not sampling the entire lot, there are two types of risk that we must consider:
The operating characteristic curve (OC curve) quantifies these risks and is a helpful performance measure of your sampling plan. The OC curve shows the probability that a lot submitted with a particular fraction defective will be accepted.

From the sample of 89 bolts, we have a 50% chance of accepting the lot when the percent defective is 3%, but only a 10% chance of accepting the lot when the percent defective is 9%.
See References for more information on acceptance sampling.