overview see also
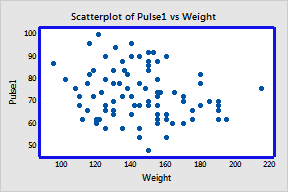
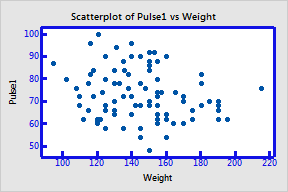
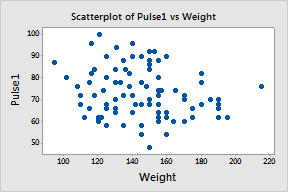
Axes and ticks provide directional and incremental points of reference for your data.
|
Scale item |
Example |
|
|
Axis Lines |
|
Extend the full length of the scale along each axis. |
|
Tick lines and labels |
|
Indicate intervals on a scale. Major ticks mark either intervals on the scale or categories, and have labels. Minor ticks mark smaller intervals between major ticks and do not have labels. |
|
Axis labels |
|
Identify the variables associated with the scale. |
|
Note |
Minor ticks cannot be used with categorical scales, because there are no logical intervals between categories. See Continuous and Categorical Scales. Time, percent, and probability scales also do not allow minor ticks. |
Axes and Ticks subdialog boxes all contain essentially the same elements, but differ in wording based on the graph type. Click the following links for graph-specific axes and ticks information: