main topic
Includes two basic components:

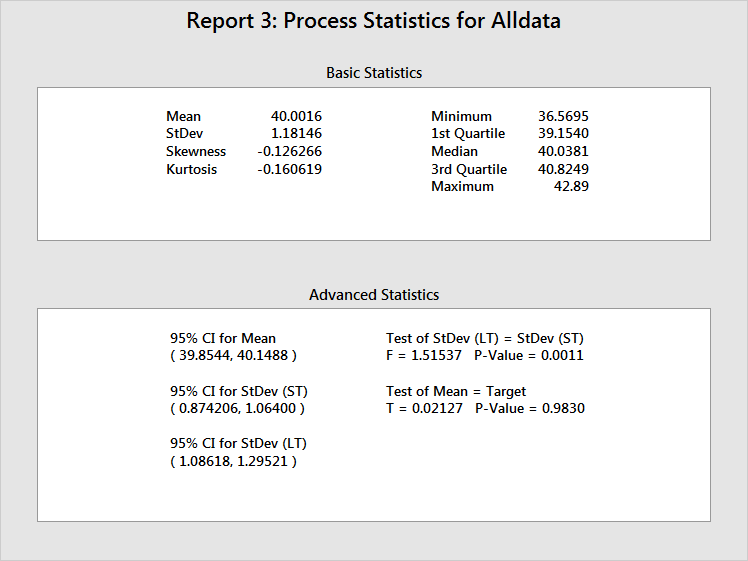
Displays the process mean and standard deviation (LT mean and LT standard deviation), as well as other basic statistics. Use skewness and kurtosis to help determine whether the data are normally distributed, although probability plots (see Report 6) are much more useful. The minimum, 1st quartile, median, 3rd quartile, and maximum show the spread of the data. For example, 25% of the data are no larger than 39.1540 (1st Quartile), 50% of the data are no larger than 40.0381 (Median), and 75% of the data are no larger than 40.8249 (3rd Quartile).
Provides statistical inferences for the process parameters, the ST mean and standard deviation.
The process mean has a 95% confidence interval and test statistics to show whether the process mean is equal to the process target. If the process mean and the process target have no statistically significant difference, the p-value should be > 0.05, and the process target will be within the bounds of the confidence interval. In the example above, the test has a p-value of 0.9830 and the target (40) is within the bounds of the 95% confidence interval for the mean. You cannot reject the null hypothesis that the process mean is equal to the process target.
There are also 95% confidence intervals for both LT and ST standard deviations, as well as a test to see whether these two quantities are equal. If there is no statistically significant difference between the LT and ST process standard deviations, you can conclude that the process does not exhibit significant shift and/or drift and that there were no special causes present when the data were collected. In the example above, the test for equal variances has a p-value of .0011; therefore you can conclude that the LT and ST standard deviations are significantly different.